Significant changes in this version
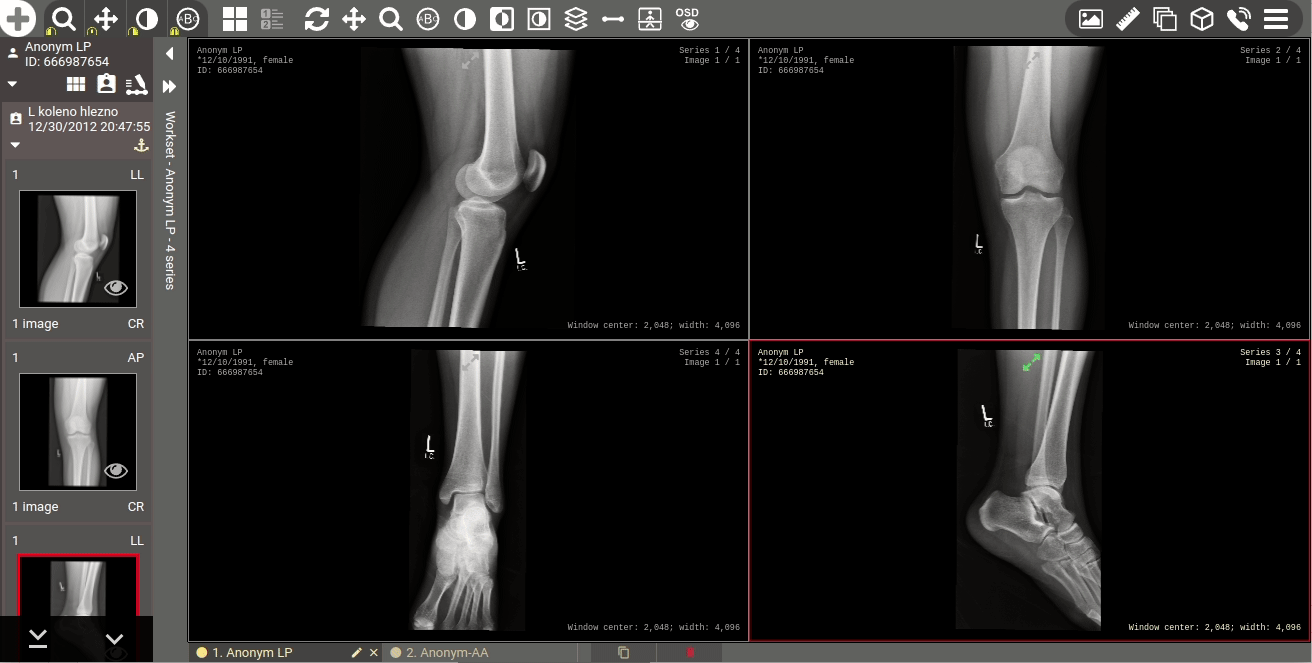
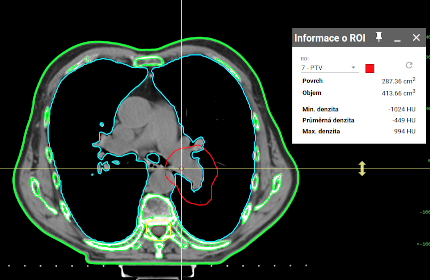
- New tools and improvements of measurement functions – In this version, a tool for convenient measurement of Norberg angles is now available to use. The vertebra marking tool has also been updated – it can now be switched to marking mode in caudal or cranial direction. The length ratio measurement tool now offers the option to set which ratio value should be displayed (A:B, B:A, shorter:longer, longer: shorter). From this version, measurements are saved in the standardized DICOM Presentation State format. Measurements stored in DPGW can now be loaded and displayed in third-party viewers. Another benefit is that the saved measurement takes up almost no space in the PACS archive, unlike the saved copy of the image. The viewer can now be set so that if a measurement is found in the working set, it is automatically loaded to the original image.
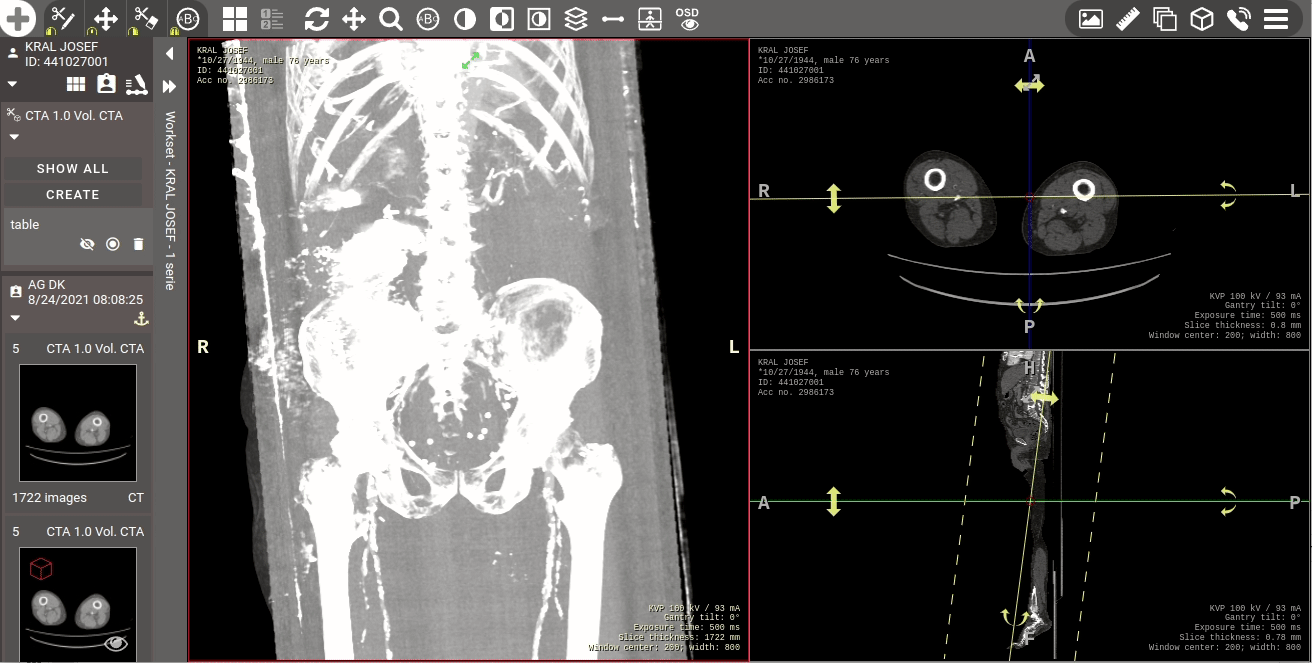
- Auto/manual synchronization switching improvement – The viewer supports manual and automatic synchronization of displaying multiple series. Automatic synchronization is applicable for series that share the same coordinate system on the patient’s body, while manual synchronization is intended for the cases of different patient data input. With these synchronizations, there is always a choice whether to synchronize only the position of the displayed image or also the brightness window settings or display transformations (enlargement, shift, mirroring…). From this version on, the switches for these synchronization options are unified.
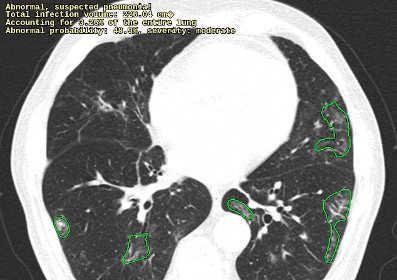
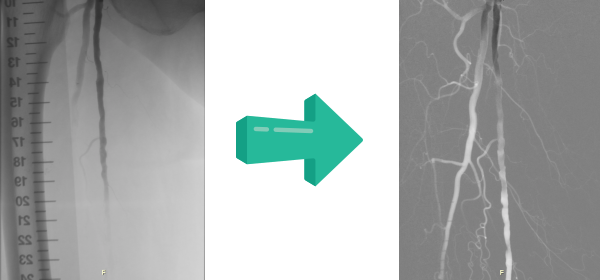
- Improvements and integration of other AI providers – We are not only continuously adding integrations with other AI providers of image analysis, but also improving existing integrations. As a part of the integration with Milvue, we have achieved a unique function where artificial intelligence facilitates the radiologist’s work by preparing distance and angle measurements in advance (especially on orthopedic images). These measurements can then be edited by the doctor in our viewer. We have successfully completed integrations with Qure.AI, Trask and Carebot.
Release information
- DPGW 0.41.12-REL released on June 2, 2022
- DPGW 0.41.13-REL released on June 10, 2022