Significant changes in this version
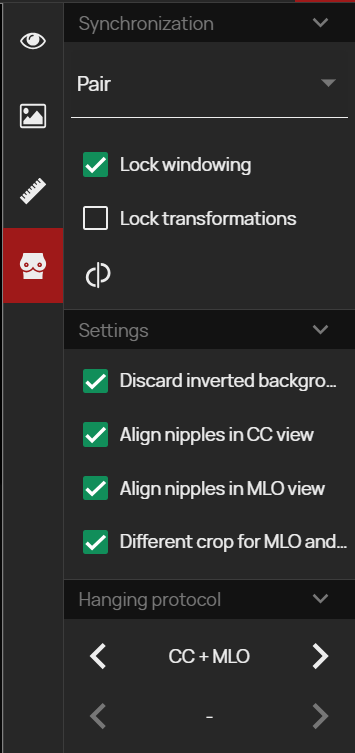
This new version brings a significant acceleration of work in the DICOM viewer environment, with up to a 4x increase in the speed of loading larger images into the viewer cache and faster retrieval of data from the server to the workstation. The speed has also been increased when using Hanging protocols, where their evaluation and application to studies has been optimized, so you can expect up to a 10x increase in the speed of displaying studies with the Hanging protocol applied compared to the previous version, with the addition of supported Hanging protocol functions.

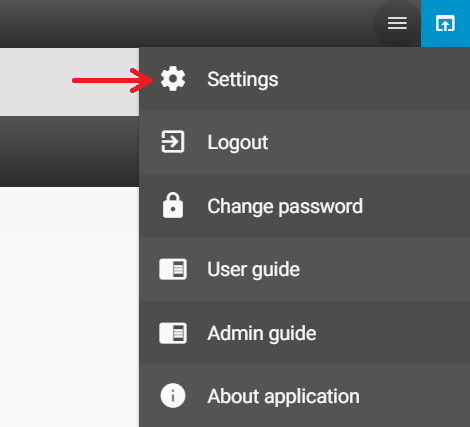
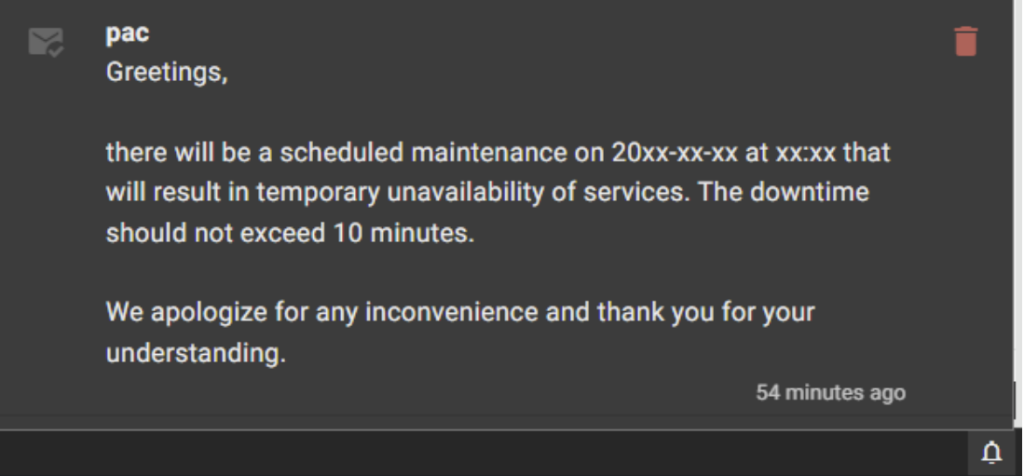
- User notifications – In this version, a complex notification system has been implemented. After logging into the system, you will see important messages sent by the PACS administrator, and you will also be able to view and manage them by clicking on the “Bell” icon in the lower right corner of the system.
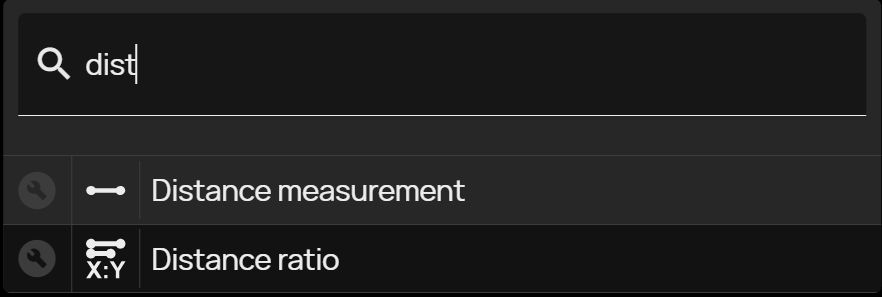
- New or modified measuring instruments:
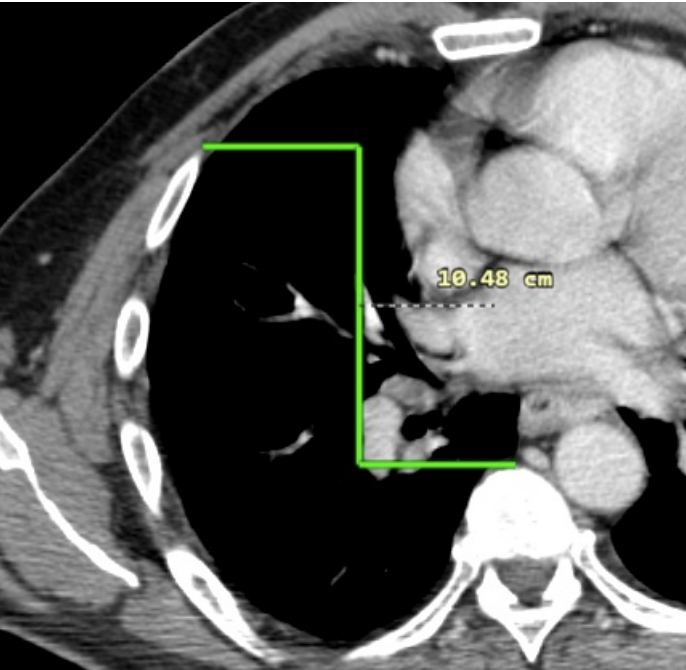
- Height differences – Measuring the length of the height difference between two selected points.
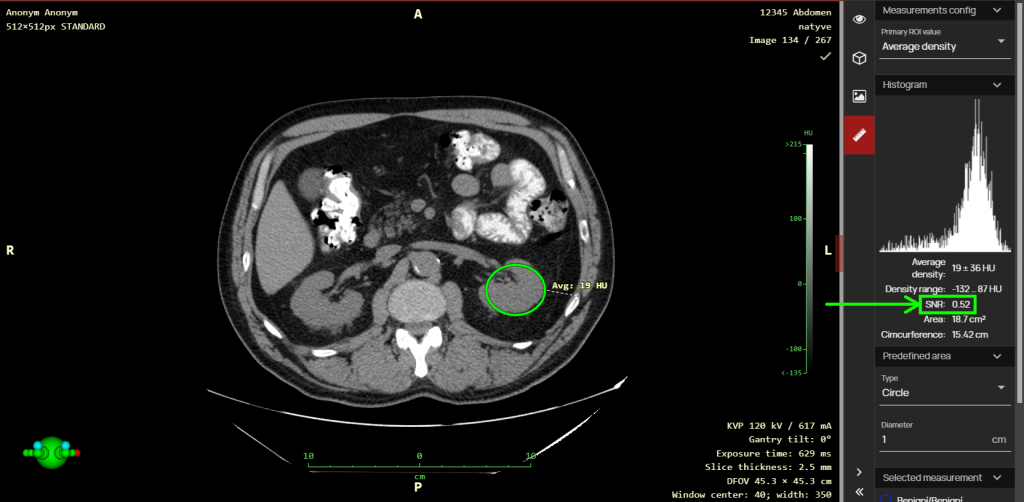
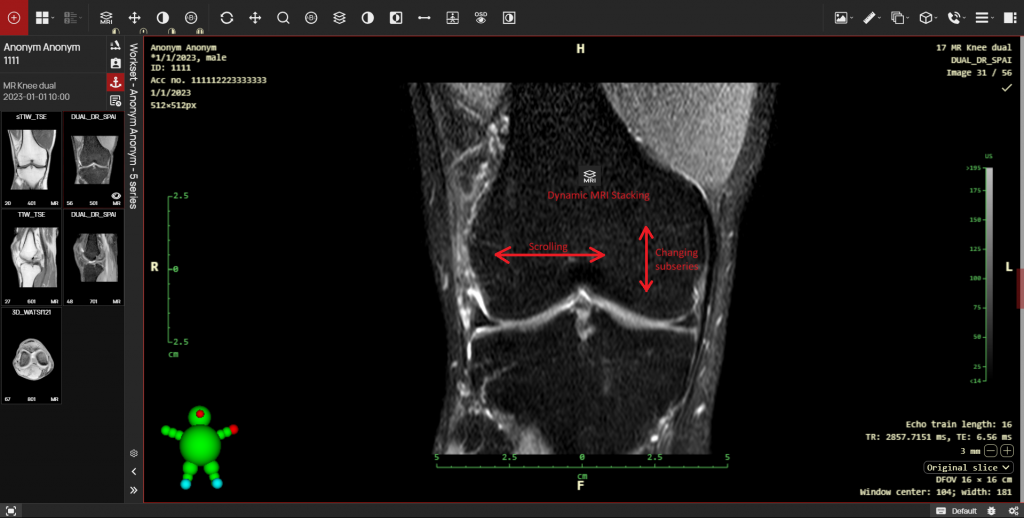
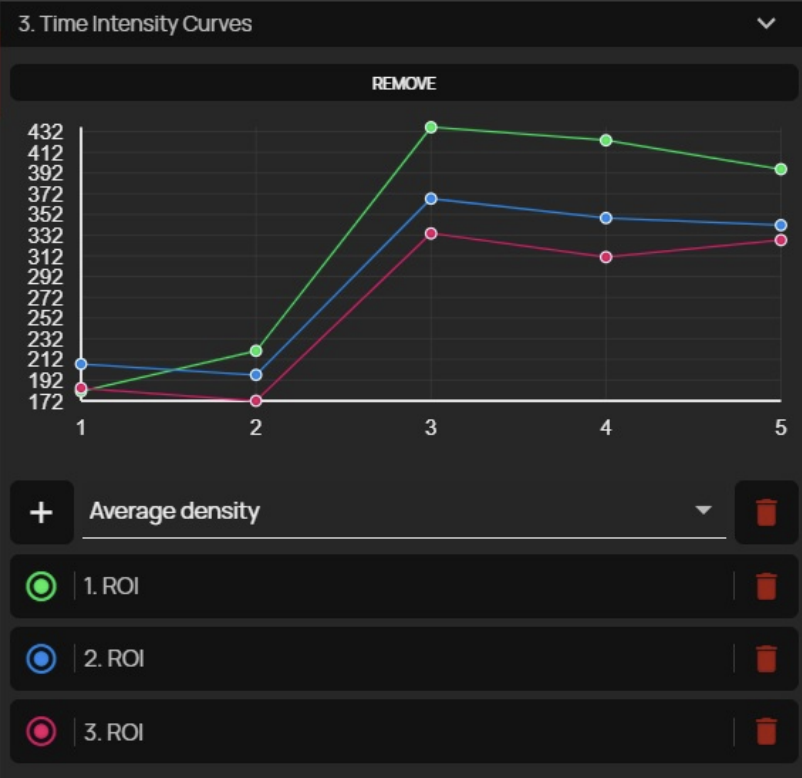
- Time Intensity Curves (TIC) – Option to create perfusion curves based on ROI density in individual time series of the study. This feature can be used, for example, in dynamic MRI sequences where it is necessary to compare ROI density at a specific location in individual time intervals.
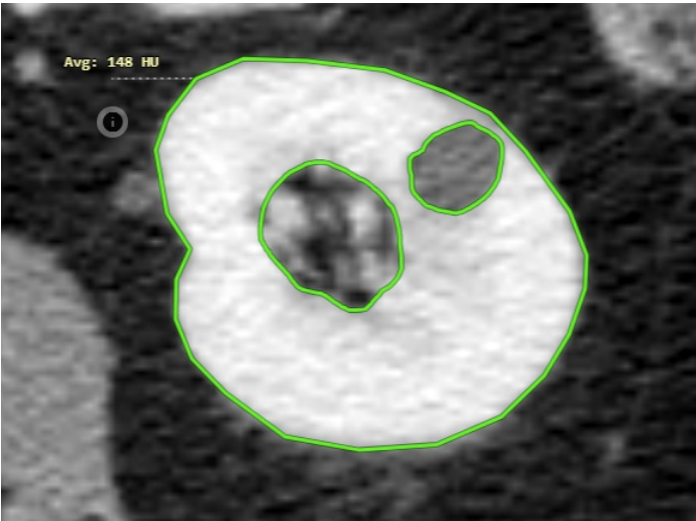
- Group area measurements – This tool is used to subtract two or more areas from each other, making it possible to draw measurements of areas with cutouts in that area.
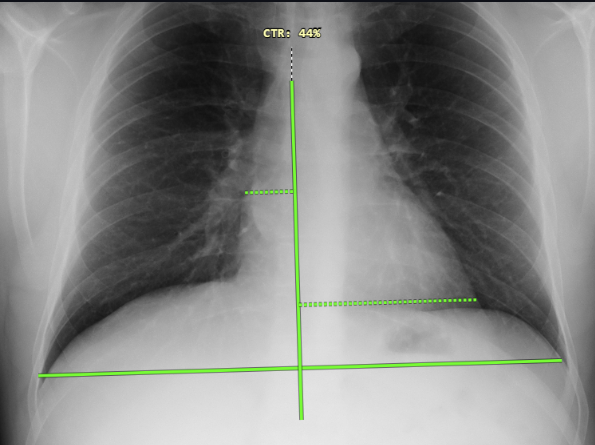
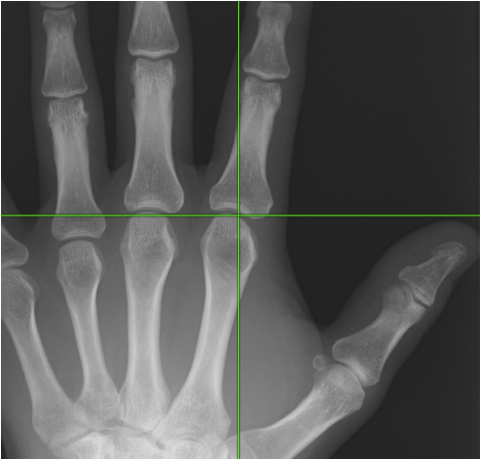
- XY axis – Option to insert horizontal or vertical axes into the image
- Using the CTRL modifier in distance measurement – If you press and hold the Ctrl key while measuring, the measurement will be taken along the XY axis, i.e. vertically or horizontally, depending on the direction of the measurement.
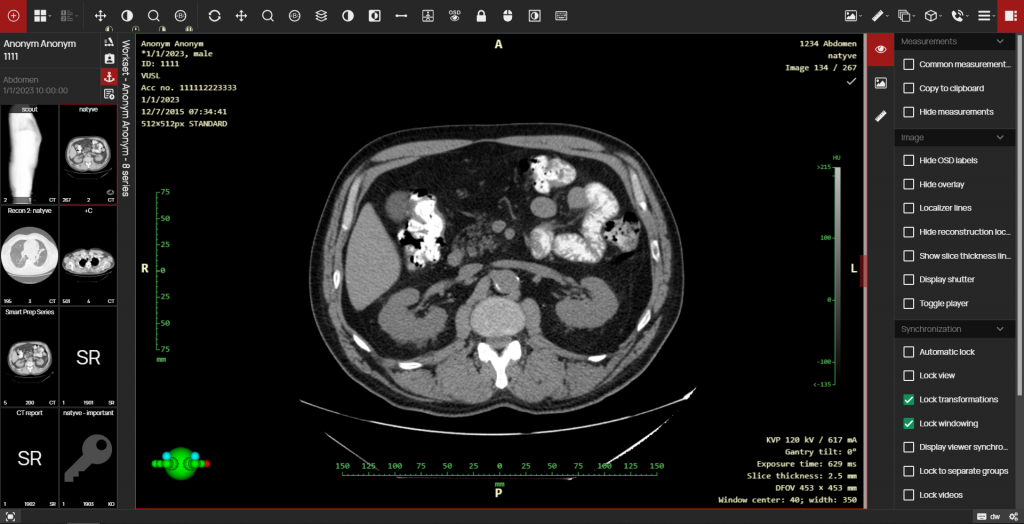
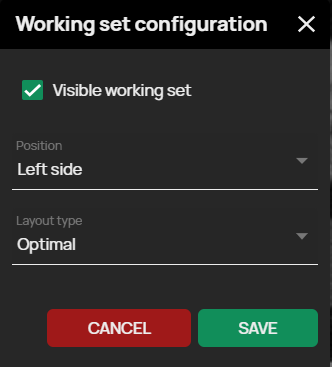
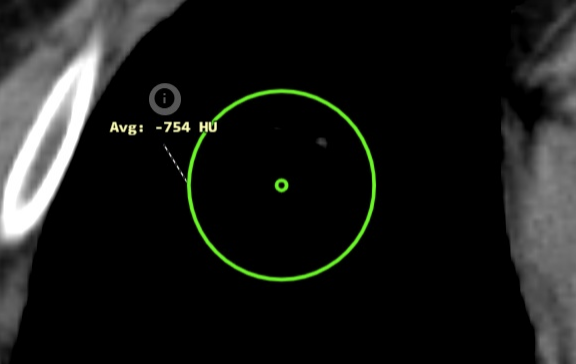
- Ellipse center – This version adds the option to display the center point when measuring the ROI of an ellipse to the “Display tools working set”.
TIP: If you hold the Ctrl key while measuring ROI (Ellipse, Rectangle), the ROI will be created from the center of the selected area. If you hold the Shift key, the ROI will be created symmetrically. These keyboard shortcuts can be combined.
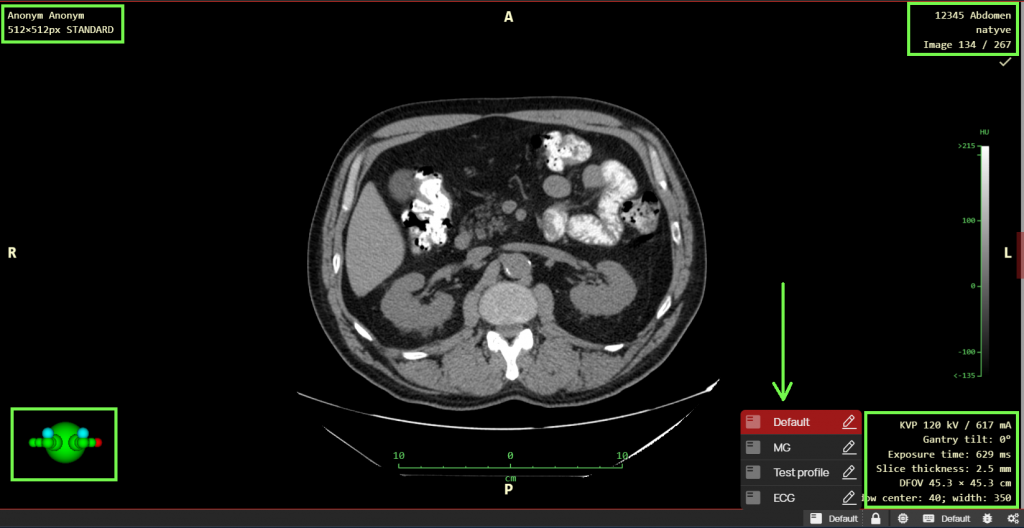
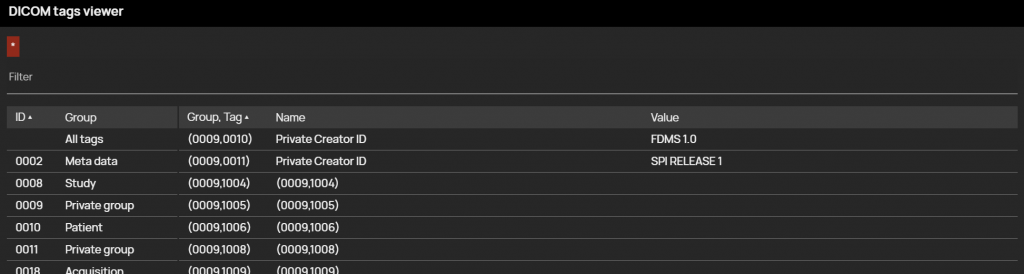
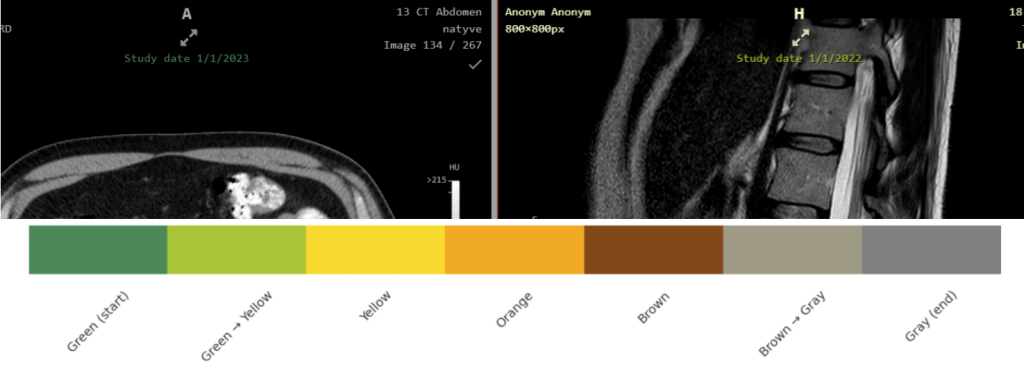
- Colored OSD labels according to study date – In the “Profile editor” tool, it is now possible to select the “Historically colored DICOM tag value” function. OSD labels can therefore be colored according to the DICOM tag value they contain, from lowest to highest, allowing two historical images to be differentiated when comparing them.
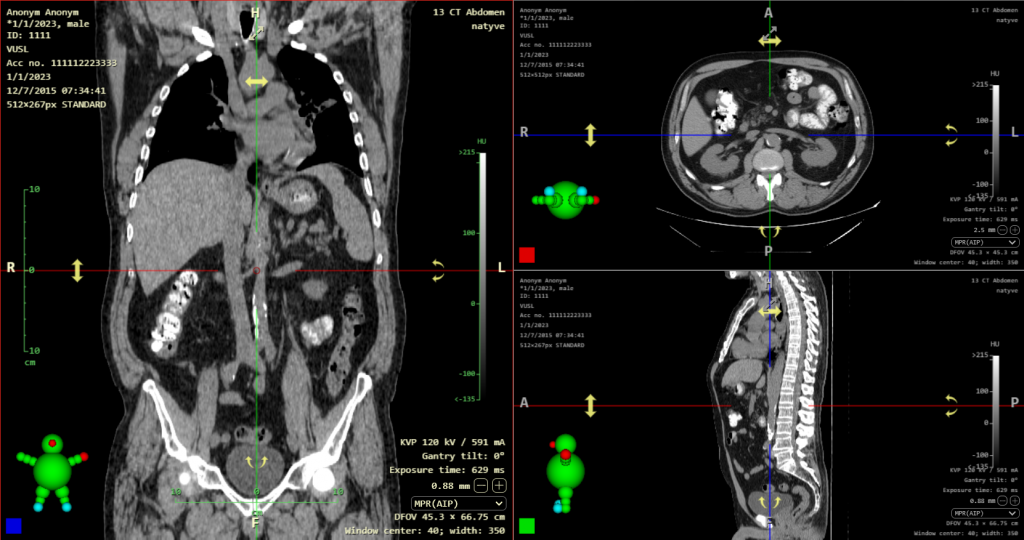
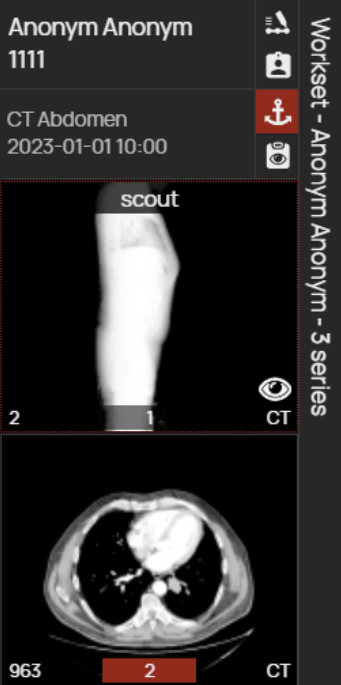
- Group series – This tool allows you to merge series of images in the viewer’s workset for better orientation. After dragging the merged series into the “Image data display window”, you can smoothly scroll through the merged series and view them all like a single serie of images. Warning: This is a virtual merging of series, which is only available for the current session. If you want to merge series directly in PACS, use the Search dialog tools in the “Archives” tab.
- Continue previous work after scheduled monitor validation – If you are requested to perform scheduled monitor validation in Dicompass, the viewer state will be saved and restored after validation, allowing you to continue without interruption.
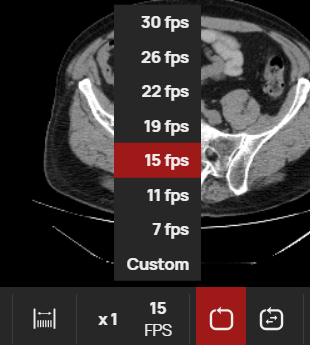
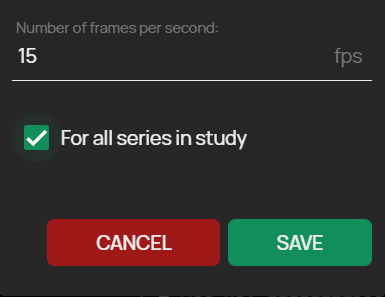
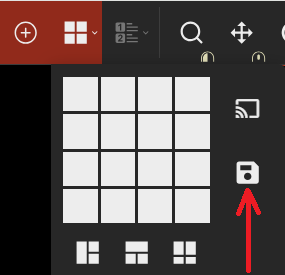
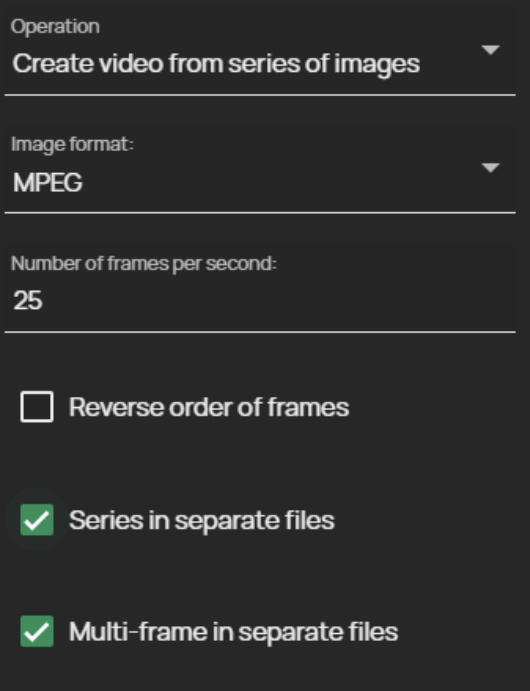
- Support for multiple series exports to individual videos:
- Series in separate files – checking this box will split exported series into individual video files
- Multi-frame in separate files – checking this box will split exported multiframe images into individual video files
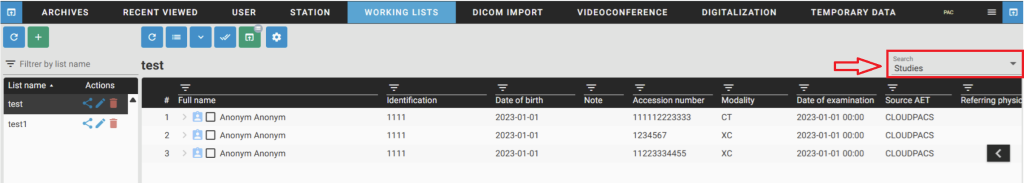
- “Working lists” features:
- PATIENT / STUDY – Image documentation added to the working list can now be switched at the study/patient level using the built-in menu.
- Notification of sharing – If you shared the created working list with the selected user, they will be informed about this via a new notification system, which is now built into this version.
Release information
- DPGW 1.13.13-REL (14. January 2026)
- DPGW 1.13.14-REL (6. February 2026)